
Evolution des civilisations de 3500 avant Jésus-Christ à nos jours.
Cartes. A Time-Lapse Map of Every Nuclear Explosion Since 1945 - by Isao Hashimoto. Représentations et cartes du monde/Représentation. The Histomap. Cartes géographiques gratuites, cartes muettes gratuites, cartes vierges gratuites, fonds de cartes gratuits. 22 maps and charts that will surprise you. By Ezra Klein on March 11, 2015 A good visualization helps you see what the data is telling you.
The best visualizations help you you see things you never thought the data would tell you. These 22 charts and maps were, at least for me, in that category: all of them told me something I found surprising. Some of them genuinely changed the way I think about the world. Carte-europe-nuls.jpg (Image JPEG, 1549 × 1077 pixels) - Redimensionnée (72%) Les surprises de la carte du monde selon les connexions à Internet. C’est une autre façon de regarder le monde : la taille des pays en fonction de la part de leur population connectée à Internet.
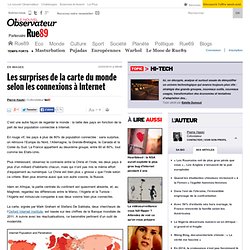
En rouge vif, les pays à plus de 80% de population connectée : sans surprise, on retrouve l’Europe du Nord, l’Allemagne, la Grande-Bretagne, le Canada et la Corée du Sud. La France appartient au deuxième groupe, entre 60 et 80%, tout comme les Etats-Unis. L’Afrique, si la colonisation n’avait pas eu lieu. 40 more maps that explain the world. Maps seemed to be everywhere in 2013, a trend I like to think we encouraged along with August's 40 maps that explain the world.
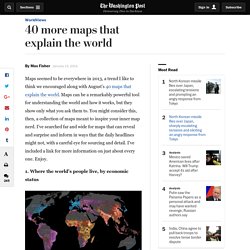
Maps can be a remarkably powerful tool for understanding the world and how it works, but they show only what you ask them to. You might consider this, then, a collection of maps meant to inspire your inner map nerd. I've searched far and wide for maps that can reveal and surprise and inform in ways that the daily headlines might not, with a careful eye for sourcing and detail. I've included a link for more information on just about every one. Enjoy. 1. Data source: Oak Ridge National Laboratory, World Bank. 40 Maps They Didn’t Teach You In School. By the time we graduate high school, we learn that they never taught us the most interesting things in there.
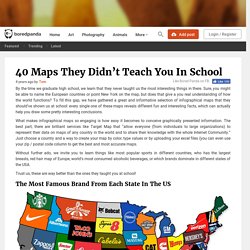
Sure, you might be able to name the European countries or point New York on the map, but does that give a you real understanding of how the world functions? To fill this gap, we have gathered a great and informative selection of infographical maps that they should’ve shown us at school: every single one of these maps reveals different fun and interesting facts, which can actually help you draw some pretty interesting conclusions. Show Full Text What makes infographical maps so engaging is how easy it becomes to conceive graphically presented information. The best part, there are brilliant services like Target Map that “allow everyone (from individuals to large organizations) to represent their data on maps of any country in the world and to share their knowledge with the whole Internet Community.”
Can Participatory Mapping Save the Commons? Top image: Transition Network.

Never before, not when Ortelius began collecting the images of the New World in his Antwerp workshop, not during the explosion of maps for railway tourists in the nineteenth century, did so many maps fly around the world so quickly. Mapping once was an arcane art, the practice of a few trained business or government data analysts; now we have a virtual cottage industry of map-makers. Imagine if Twitter were to digest for you the range of agreement, disagreement, and mood of your friends. A Visualization Of World War II Like You've Never Seen Before. Geography. 9 cartes originales qui vont changer votre regard sur la France et sur le monde. Loin des planisphères classiques que tout le monde a eu l’occasion d’étudier au cours de son parcours scolaire, certaines cartes valent mieux que de longues explications.

DGS vous fait découvrir la France et le monde sous un angle inédit à travers 9 cartes originales que vous n’avez probablement pas étudié à l’école. Les noms les plus courants en France par région Les marques les plus connues de chaque région française. Mapping redheads: which country has the most? A couple of months ago this map did the rounds.
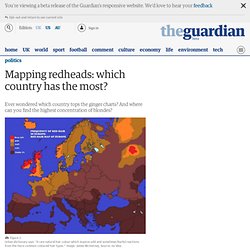
It's quite nice right? It shows that in most of Scotland and Ireland, as well as a random patch in central Russia, 10% of people are of the ginger genre. By contrast, less than 1 in every 100 people in southern Europe have red hair. Best of all, it shows all of this using a colour scale of autumnal auburns and reds. 40 Maps That Will Help You Make Sense of the World. If you’re a visual learner like myself, then you know maps, charts and infographics can really help bring data and information to life. Maps can make a point resonate with readers and this collection aims to do just that. Hopefully some of these maps will surprise you and you’ll learn something new. A few are important to know, some interpret and display data in a beautiful or creative way, and a few may even make you chuckle or shake your head. If you enjoy this collection of maps, the Sifter highly recommends the r/MapPorn sub reddit.
You should also check out ChartsBin.com. 1. 2. 3. 4. Pangea was a supercontinent that existed during the late Paleozoic and early Mesozoic eras, forming about 300 million years ago. 5. 6. 7. A New Map Of The U.S., Created From Where We Get Our Water. This map shows what America would look like if it followed its watersheds.
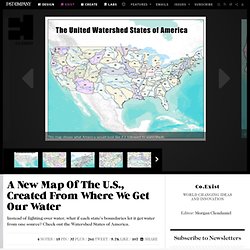
It's an America designed to use water more efficiently, and reduce state conflicts over water. Think state conflicts over water aren't a big deal? Then you don't know that Georgia, Florida, and Alabama are engaged in a massive battle over their water sources. There's a similar situation in the dry Southwest. Will the states go to war? Made by John Lavey, a land use planner at the Sonoran Institute, the map is inspired by an idea from 19th-century adventurer and geologist John Wesley Powell. Unfortunately, back then, the railway lobby wouldn't have it: The rail lobby, buoyed by Charles Dan Wilbur and his theory that “rain follows the plough,” successfully swayed congressional opinion to accept state’s boundaries in their contemporary form.
Lavey's map imagines Powell's idea across the whole of America. Without railways, intensive agriculture and mass urbanization, the West wouldn't be the West it is today.