
BI et analytique. Solution de Reporting et Data Visualisation, Tableaux de bord Entreprise. Computational insights. Where Did My Post Go? (beta) Scraping websites using the Scraper extension for Chrome. If you are using Google Chrome there is a browser extension for scraping web pages.
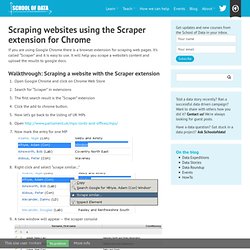
It’s called “Scraper” and it is easy to use. It will help you scrape a website’s content and upload the results to google docs. Instructional and Educational Videos, Animated Explanations, - Explania. The 20 best tools for data visualization. It's often said that data is the new world currency, and the web is the exchange bureau through which it's traded.
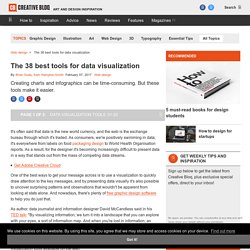
As consumers, we're positively swimming in data; it's everywhere from labels on food packaging design to World Health Organisation reports. As a result, for the designer it's becoming increasingly difficult to present data in a way that stands out from the mass of competing data streams. Get Adobe Creative Cloud.
Selected Tools. By Sindice. Free Data Visualization Software. VisiNav. VisiNav is a system to search and navigate web data, collected from a multitude of sources.
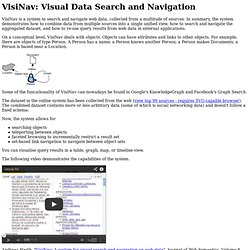
In summary, the system demonstrates how to combine data from multiple sources into a single unified view, how to search and navigate the aggregated dataset, and how to re-use query results from web data in external applications. On a conceptual level, VisiNav deals with objects. Objects can have attributes and links to other objects. Disco Hyperdata Browser. The Disco - Hyperdata Browser is a simple browser for navigating the Semantic Web as an unbound set of data sources.
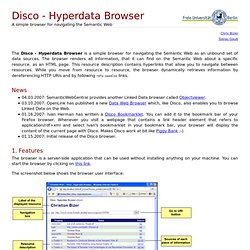
The browser renders all information, that it can find on the Semantic Web about a specific resource, as an HTML page. This resource description contains hyperlinks that allow you to navigate between resources. 9 Powerful Free Infographic Tools To Create Your Own Infographics - DATA VISUALIZATION. World Economic Datas. Clickstream Data Tools. Online Business Optimization by Omniture. Piwik - Web analytics - Open source. Yahoo! Web Analytics. Impure Blog. Polychart. Sparklines. News 15 June 2013 - Version 2.1.2 Relased This release adds support for jQuery 1.10.0 and other bug fixes and minor improvements.
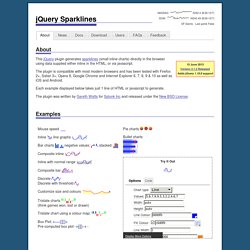
See the full changelog for details of all changes. 26 January 2013 - Version 2.1.1 Relased This release adds support for jQuery 1.9.0 along with a couple of other bug fixes. Quadrigram. Gephi, an open source graph visualization and manipulation software. Crazy Egg – visualize your visitors. The Power of Maps. Maps are both necessary tools for analysis and crucial delivery visuals for foresight and warning products.
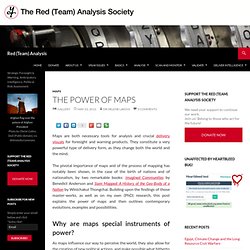
They constitute a very powerful type of delivery form, as they change both the world and the mind. The pivotal importance of maps and of the process of mapping has notably been shown, in the case of the birth of nations and of nationalism, by two remarkable books: Imagined Communities by Benedict Anderson and Siam Mapped: A History of the Geo-Body of a Nation by Winichakul Thongchai. Multiple Outcome Measurement. Jolicharts. Demo Videos. Datavisualization.ch Selected Tools. Webtrends, The Global Leader in Mobile and Social Analytics. AccuTrack SPC™ - Keyword Level Phone Call Tracking Product. The Marketer’s Challenge Digital marketing teams are tasked with optimizing campaigns across Search, Social, Mobile, Display or Email channels, with the objective of driving positive ROI.
Yet, optimization requires effective management of an array of tools and platforms. FeedBurner. iPerceptions - Customer Satisfaction Measurement. Visualization Tool. InfoGraphics (Visual Maps) Create and share visual ideas online. Venngage. Data Science Toolkit. File to Text. Usage Command Line on OS X and Linux Download python_tools.zip, extract into a new folder, cd into it and run .

/install This will create a set of scripts you can run directly from the command line, like this: html2text | text2people The command above fetches the New York Times front page, extracts a plain text version, and then pulls out likely names. File2text -h ~/scanned_documents/*.jpg > scanned_text.txt This will run OCR on all the JPEG images in that folder (the same command also works on PDF, DOC and XLS files). Ocropus - The OCRopus(tm) open source document analysis and OCR system. IP Address to Coordinates. Usage Command Line on OS X and Linux Download python_tools.zip, extract into a new folder, cd into it and run .
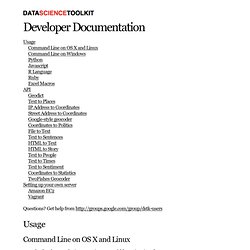
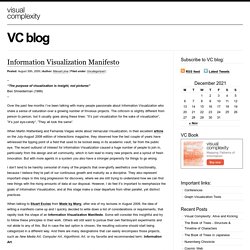
/install This will create a set of scripts you can run directly from the command line, like this: Geolocation and Online Fraud Prevention from MaxMind. Google wonder wheel. GoogAWHO. Prezi - presentation editor. Information Visualization Manifesto. Posted: August 30th, 2009 | Author: Manuel Lima | Filed under: Uncategorized | – “The purpose of visualization is insight, not pictures” Ben Shneiderman (1999) –
Sprint. SOFTWARE. Dzinpress. Online Business Optimization by Omniture. Toolbox. GazeHawk - Eye Tracking For Everyone - Usability Services & Software. Edistorm. Information Architects. Infographics. Mashable. From navigating the Web in entirely new ways to seeing where in the world twitters are coming from, data visualization tools are changing the way we view content. We found the following 16 apps both visually stunning and delightfully useful. Visualize Your Network with Fidg’tFidg’t is a desktop application that aims to let you visualize your network and its predisposition for different types of things like music and photos.
Currently, the service has integrated with Flickr and last.fm, so for example, Fidg’t might show you if your network is attracted or repelled by Coldplay, or if it has a predisposition to taking photos of their weekend partying. As the service expands to support other networks (they suggest integrations with Facebook, digg, del.icio.us, and several others are in the works), this one could become very interesting.
BigSpy places stories at the top of the screen as they are dugg. Google-refine. SIGMA.